This topic describes how you can detect and solve PostgreSQL memory availability issues.
What happened?
To detect memory availability issue on time, and have an ability to look in some historical metrics of this – you must have some kind of monitoring solution. Today, there is a rich selection of monitoring solutions – you can use any you already have, or install another one. Here we will discuss samples based on Awide management and monitoring solution.
The alert is based on the collected “Available memory” metric value and the specific thresholds this value can reach. Available memory is the amount of memory that is available for allocation to new or existing processes. This is the memory that can be given instantly to processes without the system going into swap.
This is calculated by summing different memory values depending on the platform and it is supposed to be used to monitor actual memory usage in a cross platform fashion. The metric is collected in bytes.
There are two alert’s levels:
- Warning – on reaching by default 30% of the total device memory
- Problem – on reaching by default 10% of the total device memory
The percentage is calculated by comparing the Available and Total memory metrics values. The platform will create a new alert only if the average value reached remains in the defined threshold more than 300 seconds. The platform will automatically change the alert level, e.g. from Warning to Problem, in case the metric value reaches the next threshold value.
The platform will automatically close the alert in case the value reaches by default 40% of the total device memory and remains in the defined threshold for more than 300 seconds.
Why did it happen?
Memory can be used by processes requiring a lot of memory allocation.
Most popular reason for memory shortage is slow queries.
Another reason is an increase in the number of parallel server processes can lead to memory shortages.
How to solve it?
Two cases for solving this issue:
Case 1: You see this alert immediately or very soon after it was raised. In this case we recommend to perform the following:
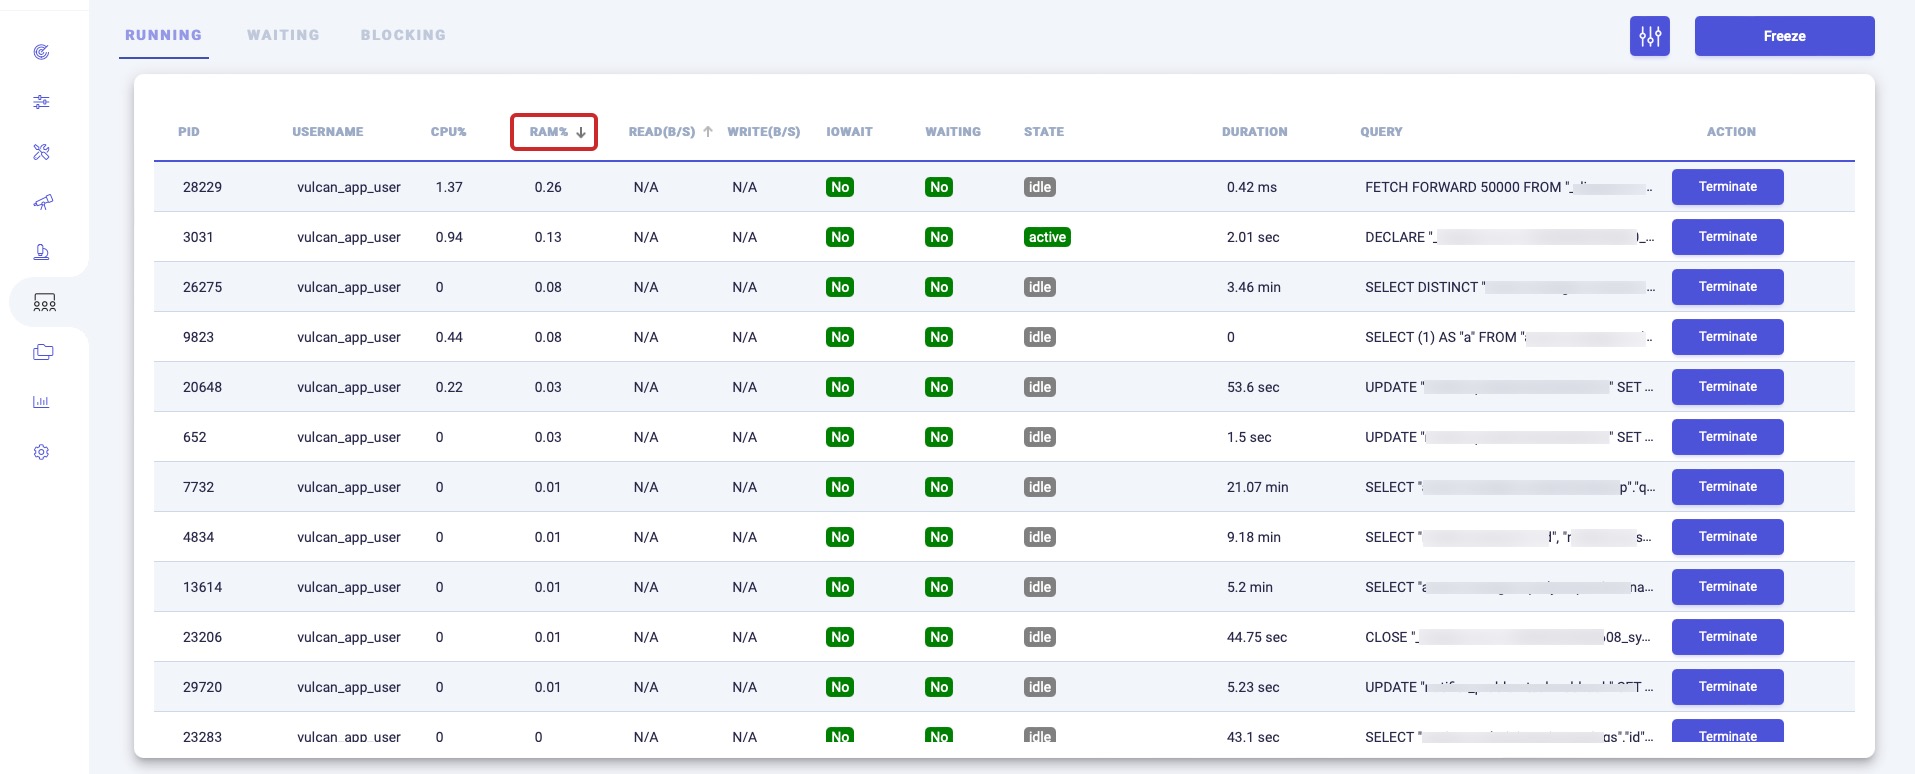
From within the platform you can find the sessions’ memory consumption by going to the Activities section, dividing into User or System processes, and then sorting them by memory usage.
In case any memory consuming session is found, click on it and check query this session is running inside:

Option one is tune the query. Run it with explain (analyze, verbose, buffers) and pay attention on the plan cost.
Option two is quick – terminating query, but consider that it can be run again by the application.
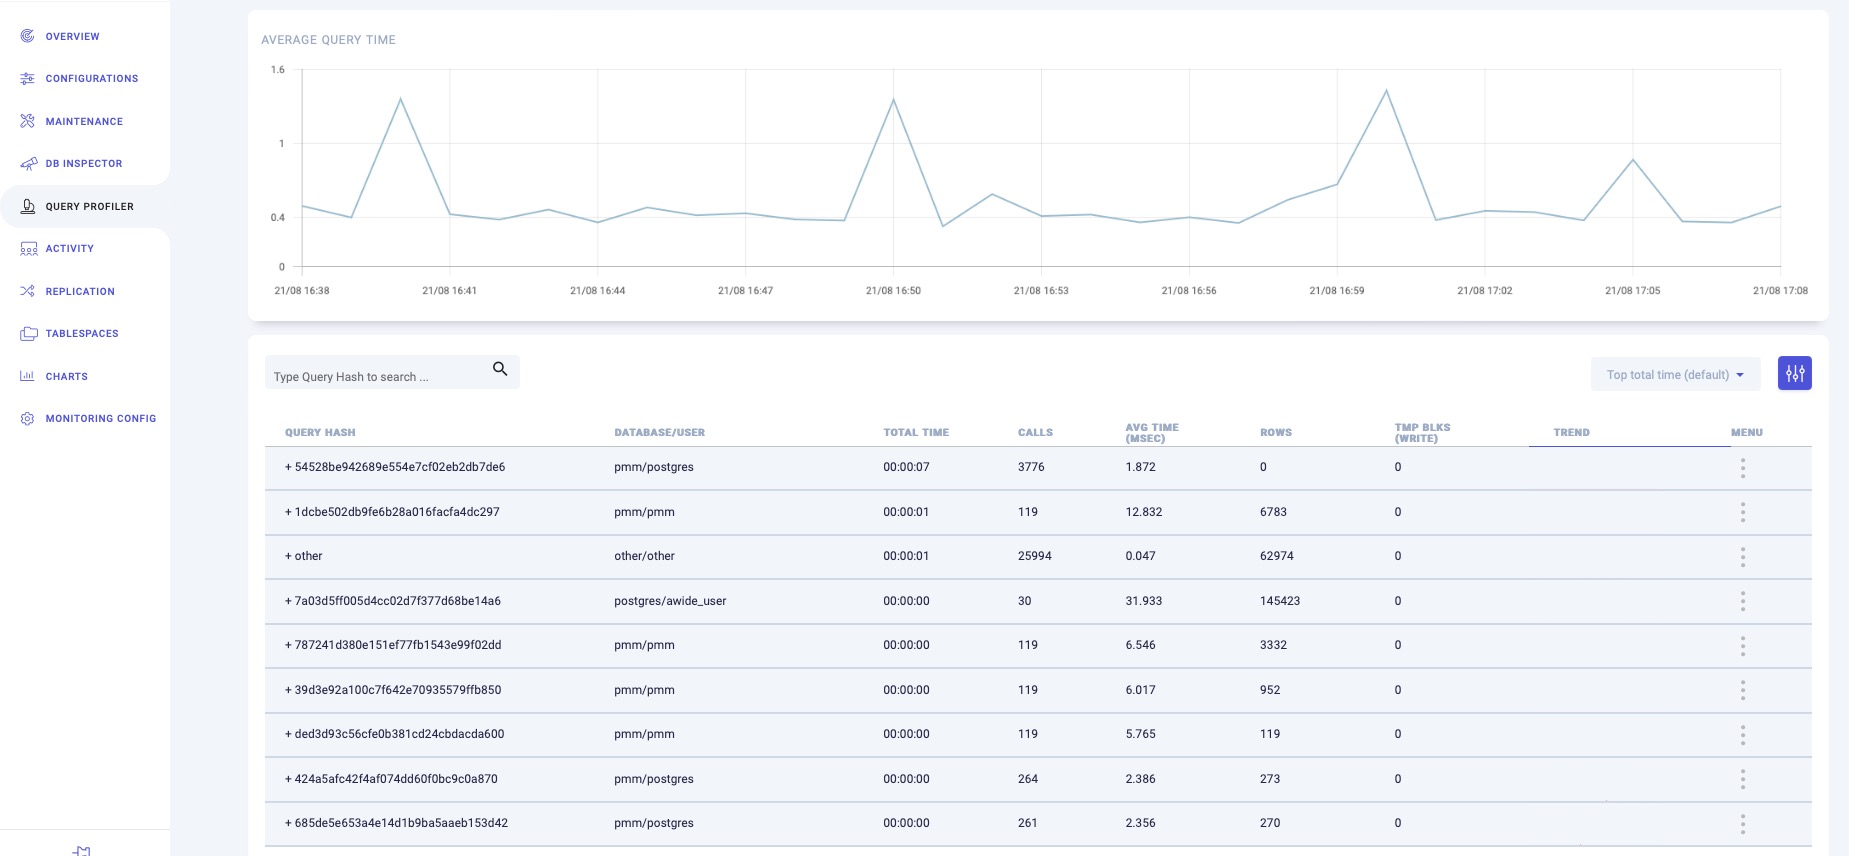
Case 2: you see this alert time a while after it has been raised. Probably, the query is not running now, but Awide has saved all query statistics for top 50 problematic queries. So, open Query Profiler – you will get queries list ordered by Top Total Time, i.e. you will see the slowest queries:

From here, the solution is the same as in the first case – tune the query.
If all your queries are fine tuned, but the memory alerts still appear, contact your system administrator or database service provider to validate that there are no other processes running on this machine. Check if those processes are necessary to run on this machine
Finally, the last way for solving memory availability issues is adding more memory to the system or creating a swap file that allows an operating system to use hard disk space to simulate extra memory.
