The Query Profiler module is used for query profiling. This module collects statistics from the pg_stat_statements extension. The data from pg_stat_statements is grouped to prevent duplication for identical requests. Only the 50 longest queries are selected for each iteration of collecting statistical information, all the others are grouped into the other block. Broad functionality is also present here. Let’s look at the functionality on this page according to the numbering in the figure below:
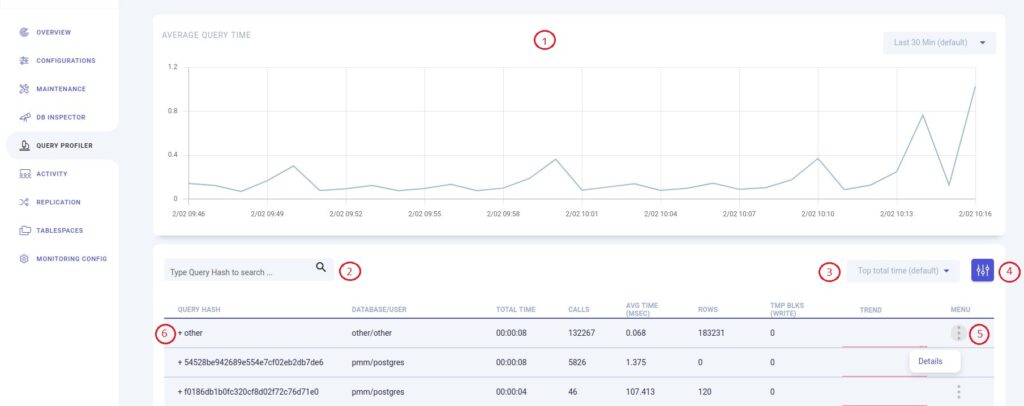
- The graph (number 1 in the figure above) displays the average execution time of queries and gives you the ability to change the time frame. The time frame has seven options to select from: last 30 mins (default), last hour, last 3 hours, last 8 hours, last 12 hours, last Day, and last week.
- Search by query hash (number 2 in the figure above).
- Display different tops (number 3 in the figure above): Top total time (default), Top returned rows, Top CPU time, Top I/O time, and Top calls.
- A filter that filters by databases (number 4 in the figure above).
- A menu with options for more detailed consideration of the query (number 5 in the figure above).
- The query appears after clicking the plus sign (number 6 in the figure above).

Copy the query to the buffer (number 1).
Detailed information about the query can be viewed by clicking on the line or selecting “Details” from the context menu:
Statistics

Let’s consider the above page according to the numbering provided:
The graph allows you to change the time frame. You can select from seven time frame options: last 30 mins (default), last hour, last 3 hours, last 8 hours, last 12 hours, last day, and last week. (number 1)
There are six different graphs for your convenience. You can switch between them by clicking on the dots (number 2):
- Time Query/Second
- Calls/Second
- Rows/Second
- CPU Time/ Second
- IO Time/Second
- Dirtied Blocks/Second
Copy the query to the buffer (number 3).
Plans
The pg_store_plans extension is required to work with query plans, as indicated in its installation documentation.

Histograms are used to present query plan usage data. Plan colors are unique to each plan. For each of the plans, the height of the column in the histogram reflects the number of calls made to that plan.
Let’s consider the above page according to the numbering provided:
The graph shows the number of calls to the selected query, with the option to change the timeframe. You can select from seven time frame options: last 30 mins (default), last hour, last 3 hours, last 8 hours, last 12 hours, last day, and last week. (number 1)
When you click the plus sign (number 2), you can see the execution plan PostgreSQL used for the selected query.

Copy the execution plan to the buffer (number 1).
Installation and configuration of pg_store_plans
The pg_store_plans extension is a modified version of the extension developed by NTT OSS Center DBMS Development and Support Team.
Installation pg_stat_statements
If you want to use the pg_store_plans extension, you must install the pg_stat_statements extension on the database where the AWIDE agent is connected and load it into shared_preload_libraries. In case pg_stat_statements is not installed, you must follow these steps:
- Debian/Ubuntu:
sudo apt-get install postgresql-contrib- RedHat/CentOS:
sudo yum install postgresql-contribInstallation pg_store_plans
To receive the pg_store_plans package, you will need to provide the Developer with information about your operating system and PostgreSQL version to support@awide.io. Run the following commands after you have copied the package to the PostgreSQL server:
- Debian/Ubuntu:
sudo apt-get install pg_store_plans- RedHat/CentOS:
sudo yum install pg_store_plansFor the extension to work, configure PostgreSQL. Add the following entries to your postgres.conf:
shared_preload_libraries = 'pg_stat_statements,pg_store_plans'Add pg_store_plans to the database where the AWIDE agent is connected:
sudo -u postgres psql
\c <MONITORING_DB>
if pg_stat_statements and pg_store_plans have never been enabled:
CREATE EXTENSION pg_stat_statements;
CREATE EXTENSION pg_store_plans;
Restart the PostgreSQL daemon
sudo service postgresql restart
Leave a Reply