On the “Overview” instance page, there are a lot of tiles. Each tile contains a pop-up information window.

- Each tile (indicated by the number 1 in the figure above) contains a pop up menu with the following two options:
- Info – with a technical description of the tile
- A pop-out window for displaying additional information:
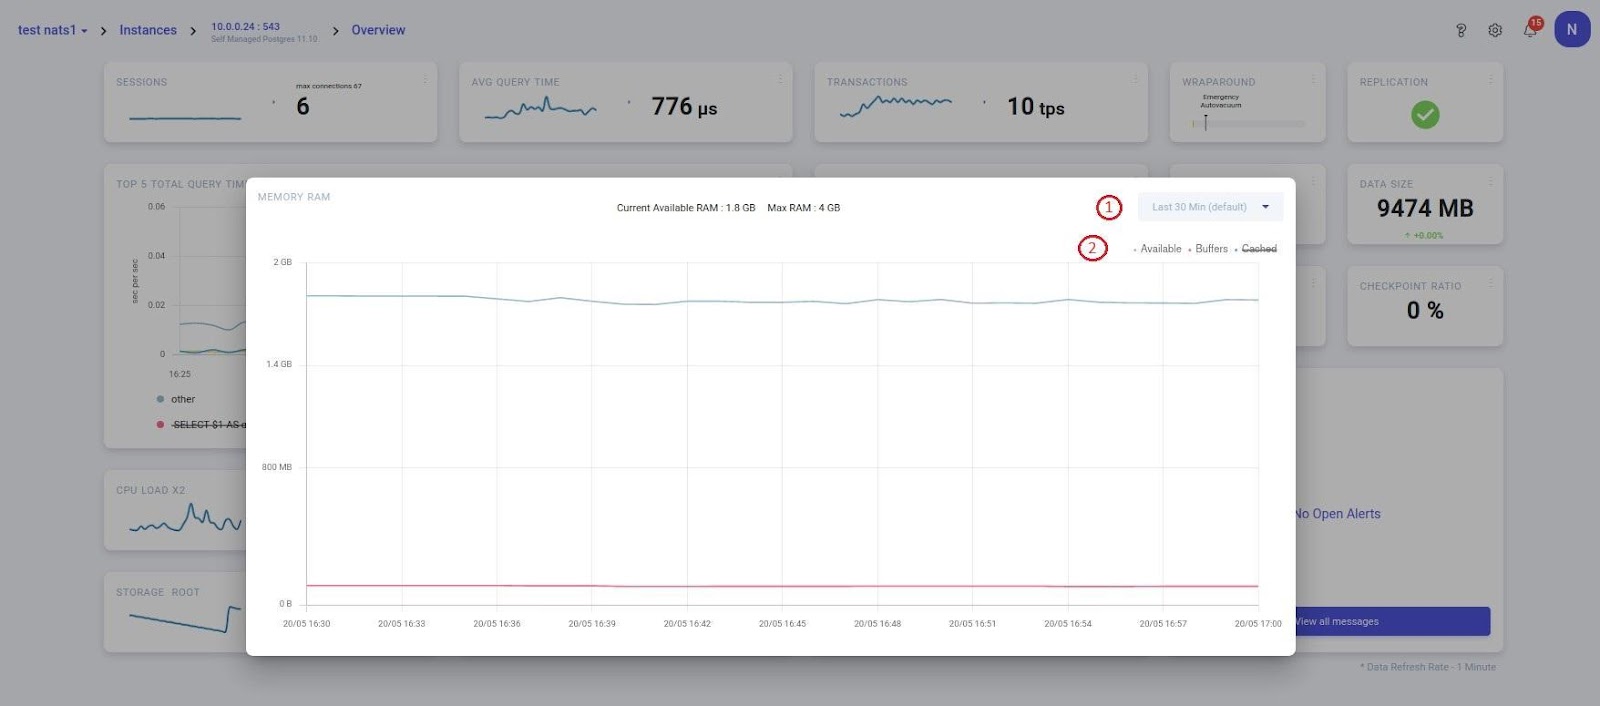
- Select the time frame from the following seven options (indicated by the number 1 in the figure above):
- last 30 mins (default)
- last hour
- last 3 hours
- last 8 hours
- last 12 hours
- last Day
- last Week
If there are several indicators, then select the one(s) that you want to show by clicking on them (indicated by the number 2 in the figure above).
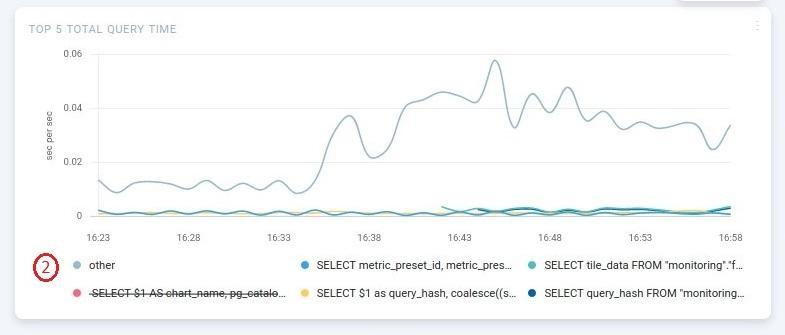
This tile is also described in the information box in the pop-up menu. Query texts (indicated by the number 2 in the image above) are shown at the bottom of the graph and you can click each one to show and hide it on the chart.

If there is a certain number of parameters you need to show (for example, more than one disk or network interfaces), use clickable points to switch between them (number 3 in the figure above)

The alert tile will display the alerts (see number 1 in the figure above) that occurred on this instance. If you click on one of the alerts, you will be taken to the page of the alert. The “View all messages” button (see number 2 in the figure above) will take you to the Alerts page.

The system hints the tile will display required changes (see number 1) which are needed for the normal functioning of the agent. If you click on one of them, then the window pops up with an explanation.

Leave a Reply